# Heat map
## Microsim
### Live player
<div class="microsim-player">
<iframe src="https://editor.p5js.org/sciencenibber/full/5v0u9S3Gm" width="100%" height="620" frameborder="0" sandbox="allow-scripts allow-same-origin"></iframe>
</div>
<div class="microsim-fallback">
<img src="Microsims/thumbs/Heat_map.png" alt="Heat_map microsim poster" style="width:100%;border:1px solid #4445;border-radius:6px;">
<p><em>Live microsim (desktop) · <a href="https://editor.p5js.org/sciencenibber/sketches/5v0u9S3Gm">open sketch in the p5.js editor</a></em></p>
</div>
**Editor URL:** https://editor.p5js.org/sciencenibber/sketches/5v0u9S3Gm
**Description (100 words):**
This microsim shows how a heat map turns a scalar field into color. A field is built from three fixed Gaussian "hot spots" and sampled on an N x N grid; each cell is painted by a colormap C that maps its normalised value t = (v - vmin) / (vmax - vmin) into the [0,1] range of the palette. Drag N to trade blocky cells for a smooth surface, drag sigma to spread or sharpen the spots, and switch among thermal, viridis, and grayscale colormaps. A colorbar legend ties color back to value, and hovering any cell reads out its raw v and normalised t.
```js
// =====================================================================
// Article : Heat map
// Slug : Heat_map
// Wikitube : en.wikitube.io/wiki/Heat_map
// Room : Visualization
//
// Idea : A heat map encodes the magnitude of a scalar field
// f(x, y) as color across a 2-D grid. This microsim builds
// a scalar field from a few Gaussian "hot spots", samples
// it on an N x N grid of cells, and paints each cell with a
// colormap C that maps the normalised value to a color.
// Sliders change the grid resolution and the spot spread;
// a selector swaps the colormap; a colorbar legend and a
// live mouse-readout make the value->color mapping explicit.
//
// Equation : Each cell color is C( (v - vmin) / (vmax - vmin) ) where
// v = f(x, y) is the sampled field value, [vmin, vmax] is the
// data range, and C: [0,1] -> RGB is the colormap.
// =====================================================================
// Rule §3 — single source of truth for the URL line and save name.
const ARTICLE = "Heat_map";
// Rule §4 — disable the Friendly Error System for ship.
p5.disableFriendlyErrors = true;
// ---------- controls ----------
let nSlider; // grid resolution N (cells per side)
let sigmaSlider; // Gaussian spot spread, in grid-fraction units
let cmapSelect; // colormap picker
// ---------- layout constants (computed in setup) ----------
let GRID_X, GRID_Y, GRID_W; // top-left and size of the cell grid
let BAR_X, BAR_Y, BAR_W, BAR_H; // colorbar legend rectangle
// ---------- the scalar field: fixed Gaussian "hot spots" ----------
// Each spot is {x, y, amp} in normalised [0,1]x[0,1] coordinates.
const SPOTS = [
{ x: 0.30, y: 0.35, amp: 1.0 },
{ x: 0.68, y: 0.30, amp: 0.7 },
{ x: 0.55, y: 0.72, amp: 0.9 },
];
function setup() {
// Rule §5 — canvas inside setup, standard size, 2x density.
createCanvas(720, 520);
pixelDensity(2);
// Grid occupies a square block on the left; colorbar sits to its right.
GRID_X = 40;
GRID_Y = 70;
GRID_W = 380;
BAR_X = GRID_X + GRID_W + 70;
BAR_Y = GRID_Y;
BAR_W = 26;
BAR_H = GRID_W;
// Rule §6 — controls built in setup, positioned explicitly, ranges
// chosen to be mathematically meaningful.
// N from 8 (coarse, blocky) to 80 (smooth); 24 reads as a classic heatmap.
nSlider = createSlider(8, 80, 24, 1);
nSlider.position(150, height - 64);
nSlider.style("width", "200px");
// sigma: Gaussian spread as a fraction of the field width. 0.05 is
// pinpoint spots; 0.40 blends them into one smooth gradient.
sigmaSlider = createSlider(0.05, 0.40, 0.16, 0.01);
sigmaSlider.position(150, height - 36);
sigmaSlider.style("width", "200px");
// Colormap selector — three classic heatmap palettes.
cmapSelect = createSelect();
cmapSelect.option("thermal");
cmapSelect.option("viridis");
cmapSelect.option("grayscale");
cmapSelect.selected("thermal");
cmapSelect.position(470, height - 64);
cmapSelect.style("width", "120px");
}
function draw() {
background(248);
// ---------- read controls ----------
const N = nSlider.value();
const sigma = sigmaSlider.value();
const cmap = cmapSelect.value();
// ---------- sample the field on the N x N grid ----------
// We need vmin/vmax to normalise, so sample once into an array.
const vals = new Array(N * N);
let vmin = Infinity;
let vmax = -Infinity;
for (let j = 0; j < N; j++) {
for (let i = 0; i < N; i++) {
// Cell center in normalised [0,1] coordinates.
const fx = (i + 0.5) / N;
const fy = (j + 0.5) / N;
const v = field(fx, fy, sigma);
vals[j * N + i] = v;
if (v < vmin) vmin = v;
if (v > vmax) vmax = v;
}
}
const span = max(vmax - vmin, 1e-9);
// ---------- draw the heat map cells (rule §8 layer 2) ----------
noStroke();
const cw = GRID_W / N;
for (let j = 0; j < N; j++) {
for (let i = 0; i < N; i++) {
const t = (vals[j * N + i] - vmin) / span; // normalise to [0,1]
const c = colormap(t, cmap);
fill(c[0], c[1], c[2]);
// y is flipped so larger row index draws lower on screen, matching
// the normalised coordinate the field was sampled at.
rect(GRID_X + i * cw, GRID_Y + j * cw, cw + 0.5, cw + 0.5);
}
}
// ---------- grid frame (rule §8 layer 1) ----------
noFill();
stroke(120);
strokeWeight(1);
rect(GRID_X, GRID_Y, GRID_W, GRID_W);
// ---------- colorbar legend ----------
drawColorbar(cmap, vmin, vmax);
// ---------- mouse hover readout ----------
// If the cursor is over the grid, report the cell value + its color.
let hover = null;
if (
mouseX >= GRID_X && mouseX < GRID_X + GRID_W &&
mouseY >= GRID_Y && mouseY < GRID_Y + GRID_W
) {
const i = constrain(floor((mouseX - GRID_X) / cw), 0, N - 1);
const j = constrain(floor((mouseY - GRID_Y) / cw), 0, N - 1);
const v = vals[j * N + i];
hover = { i: i, j: j, v: v, t: (v - vmin) / span };
// Outline the hovered cell.
noFill();
stroke(20);
strokeWeight(2);
rect(GRID_X + i * cw, GRID_Y + j * cw, cw, cw);
}
// ---------- HUD watermark (rule §2) ----------
noStroke();
textFont("system-ui");
// §2a — top-left title block.
fill(20);
textSize(20);
textAlign(LEFT, TOP);
text("Heat map", 16, 12);
textSize(12);
fill(110);
text("Wikitube microsim - en.wikitube.io/wiki/" + ARTICLE, 16, 38);
// §2b — top-right control hints.
textAlign(RIGHT, TOP);
textSize(11);
fill(110);
text("sliders: N (grid res), sigma (spot spread)", width - 16, 12);
text("select: colormap | hover a cell to read its value", width - 16, 28);
// §2c — bottom-left live readouts (canonical symbols).
textAlign(LEFT, BOTTOM);
textSize(13);
fill(20);
text("N = " + N + " x " + N + " cells", 16, height - 92);
fill(40, 90, 200);
text("vmin = " + nf(vmin, 1, 2) + " vmax = " + nf(vmax, 1, 2), 16, height - 74);
if (hover) {
fill(20);
text(
"cell (" + hover.i + "," + hover.j + ") v = " + nf(hover.v, 1, 3) +
" t = " + nf(hover.t, 1, 2),
200,
height - 92
);
}
// Slider labels (rule §7) — left of each slider, right-aligned.
textAlign(RIGHT, CENTER);
textSize(12);
fill(60);
text("N (grid resolution)", 142, height - 64 + 8);
text("sigma (spot spread)", 142, height - 36 + 8);
text("colormap C", 462, height - 64 + 8);
// §2d — bottom-right equation footer (ASCII only — see pitfalls).
textAlign(RIGHT, BOTTOM);
textSize(11);
fill(80);
text("color = C( (v - vmin) / (vmax - vmin) )", width - 16, height - 8);
}
// ---------- helpers (rule §10) ----------
// The scalar field: a sum of 2-D Gaussian bumps. sigma controls spread.
function field(x, y, sigma) {
let v = 0;
for (const s of SPOTS) {
const dx = x - s.x;
const dy = y - s.y;
const r2 = dx * dx + dy * dy;
v += s.amp * exp(-r2 / (2 * sigma * sigma));
}
return v;
}
// Colormap C: maps t in [0,1] to an [r,g,b] triple. Three palettes,
// each built by piecewise-linear interpolation through control colors.
function colormap(t, name) {
t = constrain(t, 0, 1);
let stops;
if (name === "viridis") {
// Perceptually-uniform-ish approximation of viridis.
stops = [
[68, 1, 84],
[59, 82, 139],
[33, 145, 140],
[94, 201, 98],
[253, 231, 37],
];
} else if (name === "grayscale") {
stops = [
[0, 0, 0],
[255, 255, 255],
];
} else {
// thermal: black -> red -> orange -> yellow -> white.
stops = [
[0, 0, 0],
[128, 0, 0],
[230, 90, 0],
[255, 210, 40],
[255, 255, 255],
];
}
return rampLookup(stops, t);
}
// Piecewise-linear interpolation through an array of [r,g,b] stops.
function rampLookup(stops, t) {
const n = stops.length - 1;
const scaled = t * n;
const k = constrain(floor(scaled), 0, n - 1);
const f = scaled - k;
const a = stops[k];
const b = stops[k + 1];
return [
lerp(a[0], b[0], f),
lerp(a[1], b[1], f),
lerp(a[2], b[2], f),
];
}
// The colorbar legend: a vertical gradient strip with vmin/vmax labels.
function drawColorbar(cmap, vmin, vmax) {
noStroke();
const steps = 64;
const dh = BAR_H / steps;
for (let s = 0; s < steps; s++) {
// Top of the bar = vmax (t=1), bottom = vmin (t=0).
const t = 1 - s / (steps - 1);
const c = colormap(t, cmap);
fill(c[0], c[1], c[2]);
rect(BAR_X, BAR_Y + s * dh, BAR_W, dh + 0.5);
}
noFill();
stroke(120);
strokeWeight(1);
rect(BAR_X, BAR_Y, BAR_W, BAR_H);
noStroke();
fill(60);
textSize(11);
textAlign(LEFT, CENTER);
text(nf(vmax, 1, 2), BAR_X + BAR_W + 6, BAR_Y);
text(nf((vmin + vmax) / 2, 1, 2), BAR_X + BAR_W + 6, BAR_Y + BAR_H / 2);
text(nf(vmin, 1, 2), BAR_X + BAR_W + 6, BAR_Y + BAR_H);
textAlign(CENTER, BOTTOM);
fill(90);
text("v", BAR_X + BAR_W / 2, BAR_Y - 6);
}
```
## Links (Wikipedia order)
<!-- injected from _registry/childlinks/Heat_map.json (2026-07-30T02:09:12Z) -->
`AnyChart` · [[Artificial_intelligence]] · [[Bioinformatics]] · `Biology` · `Brightness` · `C_(programming_language)` · `Choropleth_map` · `Click_tracking` · `Climate_change` · `Cluster_analysis` · `ColorBrewer` · `Color_quantization` · `Color_scheme` · `Computer_security` · `Cormac_Kinney` · `D3.js` · `DNA` · `DNA_microarray` · `Data_and_information_visualization` · `Dave_Green_(astrophysicist)` · `Ed_Hawkins_(climatologist)` · `Eye_tracking` · `False_color` · `Financial_market` · `Flinders_Petrie` · `Gene_expression` · `Geographic_information_system` · `Geovisualization` · `Gnuplot` · `Google_Fusion_Tables` · `Google_Sheets` · `HIST1H1E` · `Hue` · `Indexed_color` · `JFreeChart` · `Jacques_Bertin` · `JavaFX` · `JavaScript_library` · `Java_(programming_language)` · `Leland_Wilkinson` · `Libpng` · `Louis_Guttman` · `Matplotlib` · `Michael_Friendly` · `Mouse_tracking` · `Natural_environment` · `Noise_pollution` · `OpenGL` · `Pandas_(software)` · `Paris` · `Pedestrian` · `Peter_Sneath` · `Python_(programming_language)` · `RNA` · `R_(programming_language)` · `SS&C_Technologies` · `Scroll_wheel` · `Seriation_(statistics)` · `Short-time_Fourier_transform` · `Simple_DirectMedia_Layer` · `Smart_city` · `Spectrogram` · `Sport` · `Swing_(Java)` · `Thermography` · `Toussaint_Loua` · `Urban_planning` · `Warming_stripes` · `Waterfall_plot` · `Weather_radar` · `Website`
## From the Real GENERATIVE library
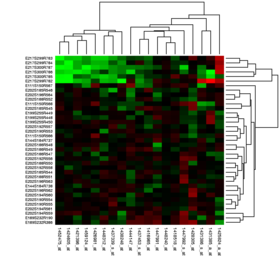
*Heat map — placed from the Real G.E.N.E.R.A.T.I.V.E. course library (Visualization room). Source: Wikimedia Commons (via Wikipedia article media). [Details & license](https://commons.wikimedia.org/wiki/File:Heatmap.png).*
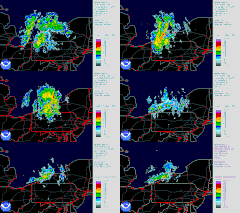
*Animated: Heat map — placed from the Real G.E.N.E.R.A.T.I.V.E. course library (Visualization room). Source: Wikimedia Commons (via Wikipedia article media). [Details & license](https://commons.wikimedia.org/wiki/File:LakeEffectSnowBuffalo101206.gif).*
> A heat map (or heatmap) is a 2-dimensional data visualization technique that represents the magnitude of individual values within a dataset as a color. The variation in color may be by hue or intensity. ([Wikipedia](https://en.wikipedia.org/wiki/Heat_map))
<!-- REAL-GENERATIVE-MEDIA:END -->
<!-- LOCAL-MEDIA-PASS:START -->
## From the vault media library
!Heat map thumb.png
*Heat Map — from the vault's own media holdings, placed 2026-07-09. MTN / Wikitube.io original · CC BY-SA 4.0.*
<!-- LOCAL-MEDIA-PASS:END -->
<!-- SIGN-SYSTEMS:START -->
**Semiotic universals** (the notations and alphabet letters this article speaks — each opens its canonical card): chart glyph dictionary · color space diagrams · temperature heat · distribution · sampling. Index: the glyph gallery · SEMIOTICS PORTAL.
<!-- SIGN-SYSTEMS:END -->
## Media (PD/CC)
<!-- MEDIA-DEPLOY:Heat_map/LakeEffectSnowBuffalo101206.gif -->
!Gif Library/Heat map/LakeEffectSnowBuffalo101206.gif
*LakeEffectSnowBuffalo101206.gif · Public domain*
<!-- /MEDIA-DEPLOY -->
> **Room:** Visualization · **Status:** ✅ shipped
## Overview
A heat map (or heatmap) is a 2-dimensional data visualization technique that represents the magnitude of individual values within a dataset as a color. The variation in color may be by hue or intensity.
_(Overview is shorter than 200 words; the pipeline should expand it from textbook context before publishing.)_
## See also
- Room hub: Visualization
- p5.js Editor conventions: P5 JS EDITOR
- Wiki root: MAIN
---
*Scaffolded by `generative-microsim` from row 2 of the Visualization sheet on 2026-06-02T17:23:24Z.*
Letters: temperature_heat · mined_visualization · distribution · sampling · field · chart_glyph_dictionary · gradient · mined_switch
<!-- REAL-GENERATIVE-MEDIA:START -->
<!-- CRAFT-LINK:START g12 -->
*Built to the [[WT!P5_js_Microsim_Master_Class|p5.js Master Class]].*
<!-- CRAFT-LINK:END -->
## Wikipedia : Wikitube
**Strict pair:** [Wikipedia](https://en.wikipedia.org/wiki/Heat_map) : [Wikitube](https://en.wikitube.io/wiki/Heat_map)
## Previous hub tags
Tree parents: [[Monte_Carlo_method]] · [[Reliability_engineering]].
Legacy hubs: `GENERATIVE`.
---
*Sources: 1 legacy note. Minted wave 1, 2026-07-30 (v1.6 order).*