# Histogram
<!-- MICROSIMGEN:BEGIN v1.7 — generated by g08_place_microsims.py; three.js first (§15); do not hand-edit inside -->
## Microsims — p5.js
### Histogram (p5.js)
<div class="microsim-player">
<iframe src="https://editor.p5js.org/sciencenibber/full/HVNGd9nMv" width="100%" height="480" frameborder="0" loading="lazy" sandbox="allow-scripts allow-same-origin" title="Histogram — p5.js microsim"></iframe>
</div>
*A normal sample of 400 points bins live; a slider or the Freedman–Diaconis, Scott, and Sturges rules set bin width, reshaping the distribution.*
**Open in the editor:** [▶ fork this sketch](https://editor.p5js.org/sciencenibber/sketches/HVNGd9nMv) · library `p5js`
*Sim hosted off-article; the article owns the reference, not the runtime (WIKI_RULES §10.4). Placed by `g08_place_microsims.py`.*
<!-- MICROSIMGEN:END -->
## Microsim
Canonical sketch: `Microsims/Histogram.js` (Betterfire Standard v0, validate_sketch 9/9 pass).
**Editor URL:** `<paste editor URL after save>`
**Description (100 words):** A normal sample of 400 points is binned live into a density-scaled histogram. A slider sets bin width manually; keys 2–4 hand control to the Freedman–Diaconis, Scott, or Sturges rule, and the readout shows the width each rule chooses. Key d overlays the true N(0,1) density curve so the eye can compare bar heights against the population they estimate; key r draws a fresh sample. Watching peaks merge and split as h changes demonstrates the central lesson of the article: the histogram's shape is a joint product of the data and the binning choice.
| Control | Symbol | Range | Effect |
|---|---|---|---|
| bin-width slider | h | 0.05–2.00 | manual bin width (rule = Manual) |
| keys 1–4 | rule | Manual / FD / Scott / Sturges | bin-width rule selector |
| key d | — | on/off | overlay true N(0,1) density |
| key r | — | — | resample N=400 |
## Links (Wikipedia order)
<!-- injected from _registry/childlinks/Histogram.json (2026-07-30T02:09:12Z) -->
`Accelerated_failure_time_model` · `Actuarial_science` · `Akaike_information_criterion` · `Analysis_of_covariance` · `Analysis_of_variance` · `Ancient_Greek` · `Anderson–Darling_test` · `Anscombe_transform` · `Arithmetic_mean` · `Arithmetic–geometric_mean` · `Asymptotic_theory_(statistics)` · [[Autocorrelation]] · `Autoregressive_conditional_heteroskedasticity` · `Autoregressive_model` · `Average_absolute_deviation` · [[Bar_chart]] · `Bayes_estimator` · `Bayes_factor` · `Bayesian_inference` · `Bayesian_information_criterion` · `Bayesian_linear_regression` · `Bayesian_probability` · `Bias_of_an_estimator` · `Binomial_distribution` · `Binomial_regression` · [[Bioinformatics]] · `Biostatistics` · `Biplot` · `Blocking_(statistics)` · `Bootstrapping_(statistics)` · [[Box_plot]] · `Box–Jenkins_method` · `Breusch–Godfrey_test` · `Canonical_correlation` · `Cartography` · `Categorical_variable` · `Census` · `Central_limit_theorem` · `Check_sheet` · `Chemometrics` · `Chi-squared_test` · `Clinical_study_design` · `Clinical_trial` · `Cluster_analysis` · `Cluster_sampling` · `Cochran–Mantel–Haenszel_statistics` · `Coefficient_of_determination` · `Coefficient_of_variation` · `Cohen's_kappa` · `Cohort_study` · `Cointegration` · `Color_histogram` · `Completeness_(statistics)` · `Confidence_interval` · `Confounding` · `Contingency_table` · `Contraharmonic_mean` · `Contrast_(vision)` · `Control_chart` · `Correlogram` · `Count_data` · `Credible_interval` · `Crime_statistics` · `Cross-correlation` · `Cross-sectional_study` · `Cross-validation_(statistics)` · `Cubic_mean` · `Curve` · `Data_and_information_visualization` · `Data_binning` · `Data_collection` · `Data_preprocessing` · `Data_transformation_(statistics)` · `Decomposition_of_time_series` · `Degrees_of_freedom_(statistics)` · `Demographic_statistics` · `Density_estimation` · `Descriptive_statistics` · `Design_of_experiments` · `Dickey–Fuller_test` · [[Digital_image_processing]] · `Dimensionality_reduction` · `Divergence_(statistics)` · `Durbin–Watson_statistic` · `Econometrics` · `Economist` · `Effect_size` · `Efficiency_(statistics)` · `Elliptical_distribution` · `Empirical_distribution_function` · `Engineering_statistics` · `Entropy_estimation` · `Environmental_statistics` · `Epidemiology` · `Errors_and_residuals` · `Estimating_equations` · `Etymology` · `Experiment` · `Exponential_family` · `Exponential_smoothing` · `F-test` · `Factor_analysis` · `Factorial_experiment` · `Failure_rate` · `Fan_chart_(statistics)` · `Feature_scaling` · `First-hitting-time_model` · `Fisher_transformation` · `Floor_and_ceiling_functions` · `Forest_plot` · [[Fourier_analysis]] · `Freedman–Diaconis_rule` · [[Frequency_domain]] · `Frequentist_inference` · `Friedman_test` · `G-test` · `General_linear_model` · `Generalized_linear_model` · `Generalized_mean` · `Geographic_information_system` · `Geometric_mean` · `Geostatistics` · `Goodness_of_fit` · `Granger_causality` · `Graphical_model` · `Greek_language` · `Grouped_data` · `Gumbel_distribution` · `Harmonic_mean` · `Heinz_mean` · `Heronian_mean` · `Histology` · `Hodges–Lehmann_estimator` · `Homophone` · `Homoscedasticity_and_heteroscedasticity` · `Hydrology` · `Image_histogram` · `Index_of_dispersion` · `Integer` · `Interaction_(statistics)` · `Interquartile_range` · `Interval_(mathematics)` · `Interval_estimation` · `Ishikawa_diagram` · `Isotonic_regression` · `Jackknife_resampling` · `Jarque–Bera_test` · `Johansen_test` · `John_Graunt` · `Jonckheere's_trend_test` · `Jurimetrics` · `Kaplan–Meier_estimator` · `Karl_Pearson` · `Kendall_rank_correlation_coefficient` · `Kernel_(statistics)` · `Kernel_density_estimation` · `Kolmogorov–Smirnov_test` · `Kriging` · `Kruskal–Wallis_test` · `Kurtosis` · `L-moment` · [[Least-squares_spectral_analysis]] · `Lehmann–Scheffé_theorem` · `Lehmer_mean` · `Likelihood-ratio_test` · `Likelihood_function` · `Lilliefors_test` · [[Line_chart]] · `Linear_discriminant_analysis` · `Linear_regression` · `List_of_fields_of_application_of_statistics` · `List_of_statistical_tests` · `List_of_statistics_articles` · `Ljung–Box_test` · `Location_parameter` · `Location–scale_family` · `Logistic_regression` · `Loss_function` · `Lp_space` · `M-estimator` · `Mann–Whitney_U_test` · `Maximum_a_posteriori_estimation` · `McNemar's_test` · `Median` · `Medical_statistics` · `Method_of_moments_(statistics)` · `Methods_engineering` · `Minimum-variance_unbiased_estimator` · `Missing_data` · `Mixed_model` · `Mode_(statistics)` · `Model_selection` · `Moment_(mathematics)` · `Monotone_likelihood_ratio` · `Multivariate_analysis_of_variance` · `Multivariate_normal_distribution` · `Multivariate_statistics` · `National_accounts` · `Natural_experiment` · `Nelson–Aalen_estimator` · `Neologism` · `Nonlinear_regression` · `Nonparametric_regression` · `Nonparametric_statistics` · `Normalization_(statistics)` · `Observational_study` · `Official_statistics` · `One-_and_two-tailed_tests` · `Opinion_poll` · `Optimal_decision` · `Order_statistic` · `Ordinary_least_squares` · `Outlier` · `Outline_of_statistics` · `Parametric_statistics` · `Pareto_chart` · `Partial_autocorrelation_function` · `Partial_correlation` · `Partition_of_sums_of_squares` · `Pearson_correlation_coefficient` · `Percentile` · `Permutation_test` · `Pie_chart` · `Pivotal_quantity` · `Pixel` · `Point_estimation` · `Poisson_regression` · `Posterior_probability` · `Power_(statistics)` · `Power_transform` · `Prediction_interval` · `Principal_component_analysis` · `Prior_probability` · `Probabilistic_design` · [[Probability_density_function]] · `Probability_distribution` · `Probit` · `Proportional_hazards_model` · `Psychometrics` · `Quality_(business)` · `Quality_control` · `Quasi-experiment` · `Questionnaire` · `Q–Q_plot` · `Radar_chart` · `Random_assignment` · `Randomized_controlled_trial` · `Randomized_experiment` · `Range_(statistics)` · `Rank_correlation` · `Ranking_(statistics)` · `Rao–Blackwell_theorem` · `Regression_analysis` · `Regression_validation` · [[Reliability_engineering]] · `Replication_(statistics)` · `Resampling_(statistics)` · `Robust_regression` · `Robust_statistics` · `Rounding` · `Run_chart` · `Sample_size_determination` · `Sampling_(statistics)` · `Sampling_distribution` · `Scale_parameter` · [[Scatter_plot]] · `Scientific_control` · `Score_test` · `Scott's_rule` · `Seasonal_adjustment` · `Semiparametric_regression` · `Seven_basic_tools_of_quality` · `Shape_parameter` · `Shapiro–Wilk_test` · `Sign_test` · `Simple_linear_regression` · `Simultaneous_equations_model` · `Skewness` · `Social_statistics` · `Spatial_analysis` · `Spearman's_rank_correlation_coefficient` · `Spectral_density_estimation` · `Standard_deviation` · `Standard_error` · `Standard_score` · `Stationary_process` · `Statistic` · `Statistical_classification` · `Statistical_dispersion` · `Statistical_distance` · `Statistical_graphics` · `Statistical_hypothesis_test` · `Statistical_inference` · `Statistical_model` · `Statistical_parameter` · `Statistical_population` · `Statistical_process_control` · `Statistical_theory` · `Statistics` · `Stem-and-leaf_display` · `Stochastic_approximation` · `Stratified_sampling` · `Structural_break` · `Structural_equation_modeling` · `Student's_t-test` · `Sturges's_rule` · `Sufficient_statistic` · `Survey_methodology` · `Survival_analysis` · `Survival_function` · [[System_identification]] · [[Time_domain]] · [[Time_series]] · `Tolerance_interval` · `Truncation_(statistics)` · `U-statistic` · `Uniformly_most_powerful_test` · `Unit_interval` · `United_States_Census_Bureau` · `University_College_London` · `V-optimal_histograms` · `V-statistic` · `Van_der_Waerden_test` · `Variance` · `Variance-stabilizing_transformation` · `Vector_autoregression` · `Violin_plot` · `Wald_test` · `Wavelet` · [[Wayback_Machine]] · `Whittle_likelihood` · `Wilcoxon_signed-rank_test` · `William_Playfair` · `Winsorizing` · `Z-test`
## From the Real GENERATIVE library
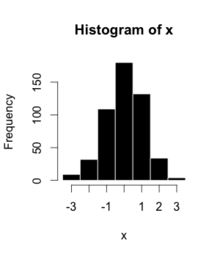
*Histogram — placed from the Real G.E.N.E.R.A.T.I.V.E. course library (Visualization room). Source: Wikimedia Commons (via Wikipedia article media). [Details & license](https://commons.wikimedia.org/wiki/File:Example_histogram.png).*
> A histogram is a visual representation of the distribution of quantitative data. To construct a histogram, the first step is to "bin" (or "bucket") the range of values— divide the entire range of values into a series of intervals—and then count how many values fall into each interval. ([Wikipedia](https://en.wikipedia.org/wiki/Histogram))
<!-- REAL-GENERATIVE-MEDIA:END -->
<!-- LOCAL-MEDIA-PASS:START -->
## From the vault media library
!Histogram thumb.png
*Histogram — from the vault's own media holdings, placed 2026-07-09. MTN / Wikitube.io original · CC BY-SA 4.0.*
<!-- LOCAL-MEDIA-PASS:END -->
> **Room:** Visualization · **Status:** ✅ validated · ← back to MAIN
## Overview
A **histogram** is the canonical statistical graphic for displaying the distribution of a single continuous variable. Adjacent bars sit on a common numeric axis, each spanning a range called a **bin**; the bar's height (or, when bins are unequal, its area) is proportional to the count of observations falling inside that bin. The shape that emerges — symmetric, skewed, bimodal, heavy-tailed — is the eye's first read on the underlying probability [[Density|density]].
The form was named and codified by Karl Pearson in 1891, though Playfair, Guerry, and Quetelet had drawn distributional bar charts decades earlier. Two design choices dominate the histogram's accuracy: the **bin width**, which trades smoothing against detail, and the **bin origin**, which can shift visible peaks across boundaries. Sturges, Scott, and Freedman–Diaconis give principled rules of thumb; any of them can mislead on small or heavy-tailed samples, so a responsible histogram always exposes the bin width as an interactive control rather than freezing one rule.
This microsim ships the room's reference distribution explorer: a chart frame and `glyphBar` row drawn over a simulated normal sample, with a bin-width slider that re-bins live, an FD/Scott/Sturges rule selector, and an overlay toggle for the underlying density curve.
## See also
- Room hub: Visualization
- p5.js Editor conventions: P5 JS EDITOR
- Wiki root: MAIN
---
*Scaffolded by `generative-microsim` from row 0 of the Visualization sheet on 2026-04-30T14:53:49Z.*
## Betterfire log
| Pass | Date | Change |
|---|---|---|
| v1 | 2026-06-10 | From-scratch Betterfire: normal sample N=400, manual bin-width slider + FD/Scott/Sturges rules, density overlay, resample; validate_sketch 9/9 pass |
<!-- REAL-GENERATIVE-MEDIA:START -->
<!-- CRAFT-LINK:START g12 -->
*Built to the [[WT!P5_js_Microsim_Master_Class|p5.js Master Class]].*
<!-- CRAFT-LINK:END -->
## Wikipedia : Wikitube
**Strict pair:** [Wikipedia](https://en.wikipedia.org/wiki/Histogram) : [Wikitube](https://en.wikitube.io/wiki/Histogram)
## Previous hub tags
Tree parents: [[Monte_Carlo_method]] · [[Reliability_engineering]].
Legacy hubs: `GENERATIVE`.
---
*Sources: 1 legacy note. Minted wave 1, 2026-07-30 (v1.6 order).*